One of the most challenging EoS modeling tasks is to develop a common EoS model for multiple fluids with gas injection. With gas injection being used as an EOR technique for shale fluids, reservoir engineers working with PVT modeling of shale fluids are frequently facing such task.
The time spent on developing a common EoS model for reservoir fluids with gas injection can be reduced considerably by following the simple recipe given below. It is a requirement that swelling data exists and the swelling experiments have been continued until the saturation point changes from a bubble point to a dew point as sketched in Figure 1.
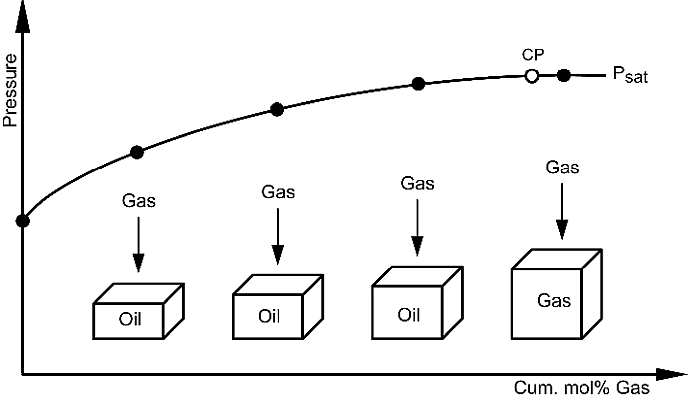
Figure 1 Swelling experiment with shift from bubble point to dew point.
The data is to be modeled using a volume corrected cubic equation of state as for example SRK-Peneloux or PR-Peneloux. It is a further requirement to have access to a multi-fluid common EoS characterization procedure as described by Pedersen et al. (2014).
Instead of tuning to all PVT data, the tuning can be limited to
- Saturation point of reservoir fluid at reservoir temperature.
- Density of reservoir fluid from flash to standard conditions (STO oil density).
- Critical point of reservoir fluid.
The saturation point of the reservoir fluid can generally be matched by adjusting the plus molecular weight by 5-10% while keeping the weight% composition constant. Such adjustment is justified because of the experimental uncertainty on the plus molecular weight. The STO oil density can be matched by adjustment of the Peneloux volume correction parameter of the C7+ components.
The critical point of a reservoir fluid will not in general be known, but it can be determined in an indirect manner. Figure 2 shows two phase envelopes. They are for the same oil mixture, but using two different EoS models (EoS 1 and EoS 2). The saturation pressure at the reservoir temperature is almost the same, but with EoS 1 the critical temperature is 409 oC (768 oF), while it is only 360 oC (680 oF) with EoS 2.
.png)
Figure 2 Phase envelope of oil mixture using two different EoS models.
Figure 3 shows experimental and simulated liquid dropout curves for swollen mixtures of the oil in question using EoS 1 and EoS 2. With 150 mole% gas added (grey points), the saturation point is a bubble point. With 400 mole% gas added (dark blue points), it has shifted to a dew point. The fluid composition becomes critical somewhere in that interval. At near critical conditions the liquid dropout curve would start out almost vertical from either 100% liquid volume (T < Tcrit) or from 0% liquid volume (T > Tcrit). The experimental liquid dropout points for 150 mole% gas added in Figure 3 shows a fairly steep decrease in liquid volume with decreasing pressure signaling a fluid approaching criticality. The liquid dropout points for 400 mole% gas added on the other hand has a relatively moderate increase in liquid volume with decreasing pressure. The simulation results with EoS 2 reflects the experimental behavior, but EoS 1 does not.

Figure 3 Exp. & Sim. liquid dropout for swollen mixtures. % gas is mole% gas added per initial mole oil.
Figure 4 shows experimental and simulated swelling saturation pressures. With both EoS models the experimental saturation pressures are matched well, but 328 mole% of gas must be added per initial mole oil to create a critical composition with EoS 1, while only 244 mole% gas is required with EoS 2. This is reflected in the simulated liquid dropout curves in Figure 3. With EoS 1 the liquid dropout curve starts out relatively steep after 400 mole% gas has been added, which is an indication of near-critical behavior. With EoS 2 the simulated liquid dropout curve after addition of 400 mole% gas is relatively flat, signaling some distance from a critical composition.

Figure 4 Experimental and simulated swelling saturation pressures.
The observed difference in critical point on the swelling curve in Figure 4 leads back to the difference in critical point in Figure 1. The higher the difference between the critical temperature of a reservoir fluid and the reservoir temperature, the more gas is required to shift the critical temperature to that of the reservoir. As can be seen from the right hand plot in Figure 3, EoS 2 provides as almost perfect match of the liquid dropout curves of the swollen mixtures. The good match is achieved solely by tuning to a critical temperature of 360 oC and to the saturation pressure at the reservoir temperature. With EoS 1 too much gas is to be added before a critical composition is reached. This is due to the fact that EoS 1 predicts a too high a critical temperature of the reservoir fluid.
An alternative to matching the critical point of the reservoir fluid itself is to match the critical composition on the swelling curve. For the case studied, the critical composition is in the interval from 150 to 400 mole% gas added per initial mole oil, and therefore relatively undefined. In such case it can be easier to determine the critical point in an indirect manner as outlined above.
The above can be condensed to the following regression strategy for multiple fluids with swelling data to be represented using a common EoS model.
Tech Talk Recipe
- Choose a volume corrected equation of state (SRK-Peneloux or PR-Peneloux).
- Decide on an appropriate lumping scheme.
- Use the characterization procedure of Pedersen et al. (1992).
- For each fluid to be represented using a Common EoS model, do the following
i. Adjust the plus molecular weight to match the saturation point at the reservoir temperature using a constant weight% composition.
ii. Adjust the volume correction (Peneloux parameter) to match the density of the liquid from a flash of the reservoir fluid to standard conditions.
iii. Simulate the critical point of the reservoir fluid.
iv. Simulate the swelling experiment.
v. Check whether the critical temperature of the reservoir fluid is too high or too low. It is too high if the liquid dropout curve of the fluid from the last swelling stage increases too steeply with decreasing pressure. It is too low if the liquid dropout curve increases too little with decreasing pressure.
vi. Carry out a plus regression (Christensen, 1999). The data tuned to is the saturation pressure at reservoir temperature and an assumed critical temperature selected in accordance with v. Do not tune to any other data.
vii. Simulate the swelling experiment again. If the match of the liquid dropout curves of the swollen mixtures is satisfactory go to 5. Otherwise go to v.
- Carry out a Common EoS plus regression. For each reservoir fluid tune to saturation pressure at the reservoir temperature and the critical temperature determined in 4.
- Compare simulated and experimental data.
The above procedure can be expected to give a good match, not only of the data tuned to, but of all routine and EOR PVT data existing for the fluids to be represented by a common EoS model.
For a reservoir fluid the saturation pressure at the reservoir temperature and the critical point together constitute a finger print. That is the reason a tedious parameter tuning can be avoided by directing the tuning towards the critical point of the reservoir fluid.
References
Christensen, P.L., “Regression to Experimental PVT data”,Journal of Canadian Petroleum Technology, 38, 1999, pp. 1-9.
Pedersen, K.S., Christensen, P.L., Azeem, J., “Phase Behavior of Petroleum Reservoir Fluids”, Section 5.9, 2nd edition, Taylor & Francis, Boca Raton, US, 2014
Pedersen, K.S., Blilie, A.L., Meisingset, K.K., ”PVT-Calculations on Petroleum Reservoir Fluids Using Measured and Estimated Compositional Data for the Plus-Fraction”, Ind. Eng. Chem. Res. 31, 1992, pp. 1378-1384.